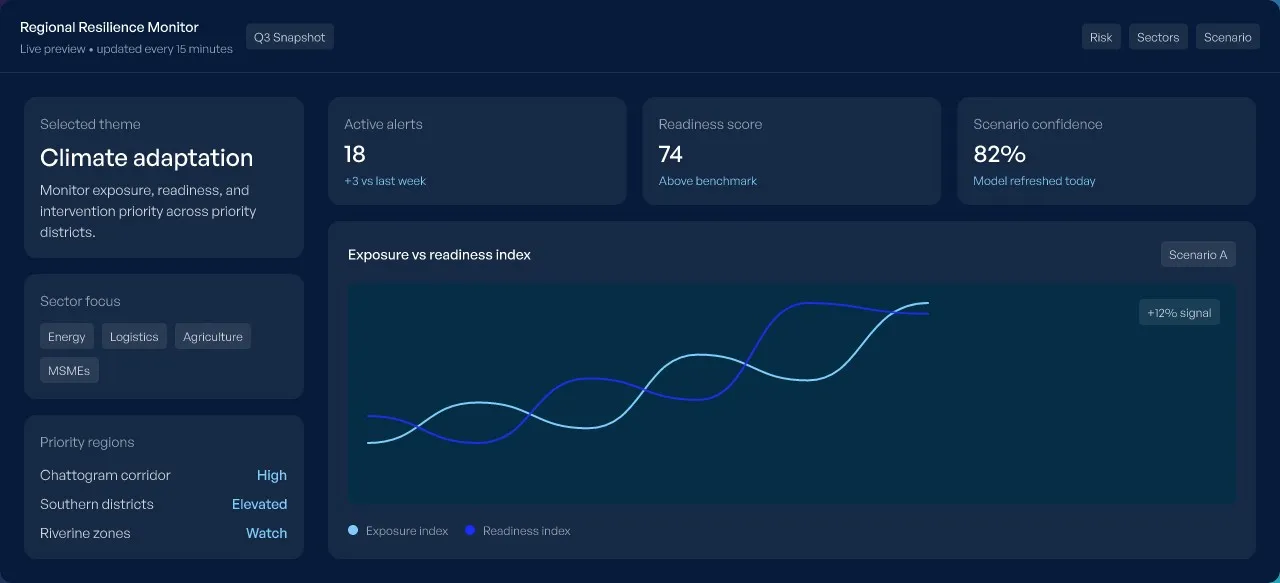


Climate Risk & Adaptation Monitor
A live view of exposure, readiness, and intervention priority across high-impact districts and sectors.
Interactive dashboard
The dashboard loads from an external host when you open it. Open it in a new tab.
Overview
This dashboard brings together regional exposure, readiness indicators, sector vulnerability, and intervention priority into a single decision layer. It is designed for executives, program leads, and investment teams who need to see where risk is concentrated and where response capacity is strongest.
- Theme: Climate
- Sector: Public Policy
- Refresh: weekly
- Last updated: Aug 2026
Key data
- High-exposure districts
- 18
- Readiness score
- 74
- Priority interventions
- 12
- Model confidence
- 82%
Methodology
The dashboard combines geospatial hazard data, infrastructure status, enterprise activity, and program-level readiness indicators. Signals are normalized across sources, weighted by recency and confidence, and presented as a single weekly view.
- Sources include satellite-derived hazard layers, utility telemetry, survey-based readiness inputs, and field-program updates.
- Weighting adjusts for data freshness, sector relevance, and geographic coverage before each weekly refresh cycle.
- Scenario views allow teams to compare baseline conditions against intervention or stress assumptions without leaving the dashboard.